High Tech Problem Solving
Skills Assessment
Note: The Skills Assessment Stack is ©1994,
1995, 1996, and 1998 by James P. Riser (all rights are reserved)
and is not yet completed. This page does illustrate the concept.
The experimental model shown here is fully operational.
Background information:
I have been experimenting with using
technology to develop an exciting assessment tool for use with
my students. When I began developing this assessment tool in the
summer of 1993 as I was working on my "An Introduction to
Image Processing"
CD-ROM, I had several goals in mind. I wanted to design a tool
that would determine the abilities of students in the following
categories: making observations (qualitative and quantitative);
making inferences; collecting data; organizing and displaying
data; graphing data; interpreting data; detecting patterns; using
coordinates; using formulas; problem solving; working with ratios,
areas, percentages; working with and identifying variables; orienting
in three dimensions; using contour maps; calculating rates; interpolating;
extrapolating; identifying important information; predicting;
identifying properties; comparing; evaluating; and classifying.
I wanted to design an assessment tool that would be interesting
to the person being assessed; be a learning tool; be non-threatening;
be non-sexist; be non-ethnic; and be a skill assessment rather
than a vocabulary test. This assessment tool is still under development
and gets enhanced as I find time in the evenings and on weekends
to work on it. This tool is designed to help improve instruction
not just line the pockets of test sellers.
Since developing this tool, I have
been contacted by several "student test making firms".
Without exception, they were interested until they saw that it
would change the way student skills assessment is done and might
put them out of business! They love the needless paper shuffling
that their firms have pushed upon the school systems. Mark my
words, one day a system such as mine will be implemented and there
will be no turning back.
The included screen shots illustrate
a portion of the completed assessment tool.
Software considerations:
This Skills assessment tool relies
extensively on QuickTime (avi or mpeg would do fine also). When
I began this project, I was running an Apple Classrooms of
Tomorrow (ACOT) science lab equipped with Macintoshes. I had
done extensive
experimentation with HyperCard (using HyperGASP) and really liked
the way it could handle the background "record keeping"
and the graphics. Unfortunately, Apple has not really kept the
product current and made it cross platform. HyperStudio can easily
display the graphics (though not as elequently as HyperCard);
but does not easily do all the record keeping. CourseBuilder can
beautifully do the record keeping; but is very clunky and limited
with the graphics. (There is a
new version of CourseBuilder in the works which might address
the graphic and cross platform issues.) Podium for the PC platform
is outstanding; but still not cross platform. Unfortunately, I
have no money to purchase Macromedia Director. It would probably
do everything quite well. I am considering writing everything
to run in JAVA to solve the cross platform issue. What you will
see here is non-interactive screen shots of the tool in action.
Feedback is always welcome.
The Assessment Tool:
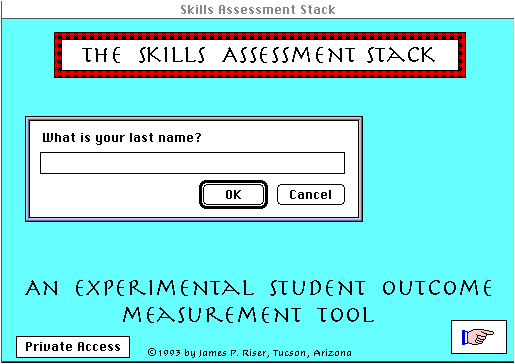
As the assessment begins,
students are asked to type in: last name, first
name, matriculation number, age, male/female (M/F), magnet student
(Y/N), and their ethnic
code. The screen shot below illustrates how this information is
collected.
Since the format of such an assessment tool is unfamiliar to students,
an instruction screen
explains how the whole thing works. This card is shown below.
Illustrated is a sample of one type
of QuickTime movie.
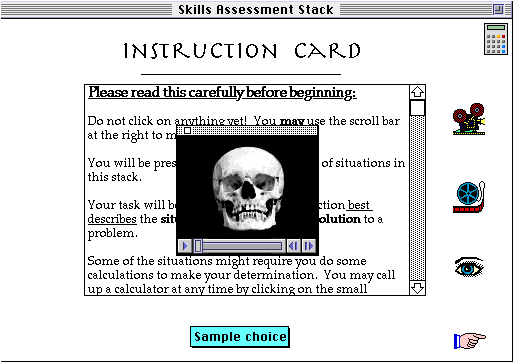
A calculator is available to students at all times (upper right
hand corner) throughout the
assessment.
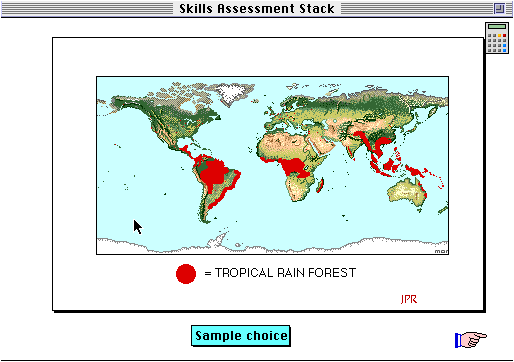
Also shown is a sample picture so students will know what to expect.
The advantage of using technology as an assessment tool will become
apparent as the various
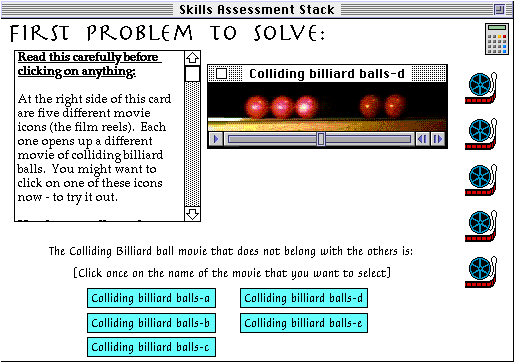
activities are demonstrated. The first problem for students involves
examining and comparing
several QuickTime movies of rolling and colliding billiard balls.
Students will be looking for a
pattern that is common in all of the movies except one. Students
are able to run the movies and
look at them as often and as long as they feel is necessary. This
use of QuickTime movies
duplicates what would be seen in an actual lab situation except
for the odd movie. This odd
movie was created by editing the digital movie to create a unique
collision situation which would
never occur in nature. Written assessment tools can not do this.
The accompanying screen shot
illustrates one of the QuickTime movies.
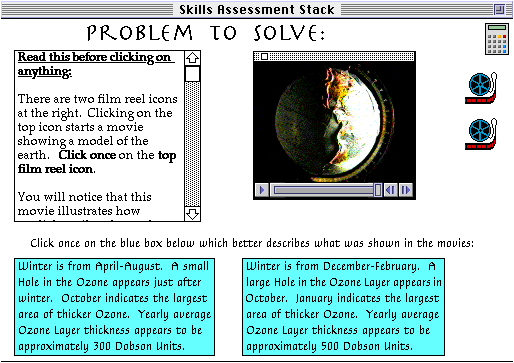
Another item on the assessment involves students examining a QuickTime
movie illustrating the
earth rotating as the sun illuminates it.
In addition, students examine (month by month) a years worth of
ozone layer thickness images.
These two sets of information will need to be mentally assembled
by the students to determine
which description better describes the situation seen by the students.
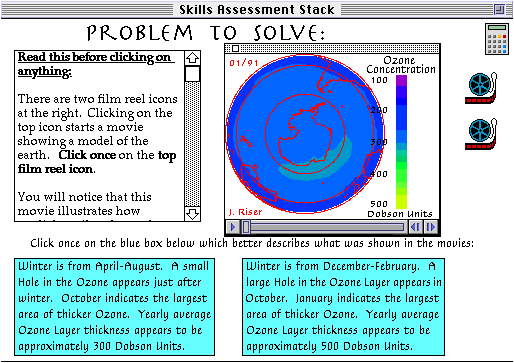
Again, students may examine the data as long as necessary.
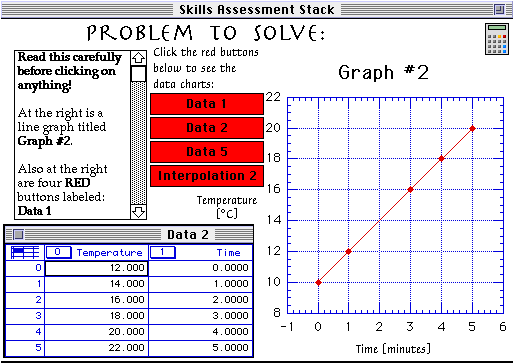
Another assessment activity involves the students matching up
a graph with the data chart used to
create the graph.
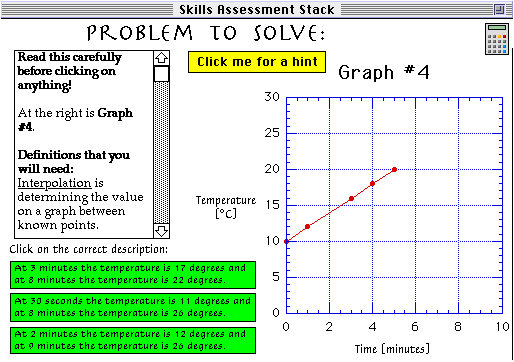
Graph interpretation skills are assessed with the following activity.
I haveeven included a hint
graph with this activity. Unlike with so many assessment tools,
my goal is not to trick students but
to help them and to give them every opportunity to demonstrate
their skills.
The real data keeping power of technology is obvious on the "secret"
or teachers only portion of
the assessment tool. This screen is shown below.
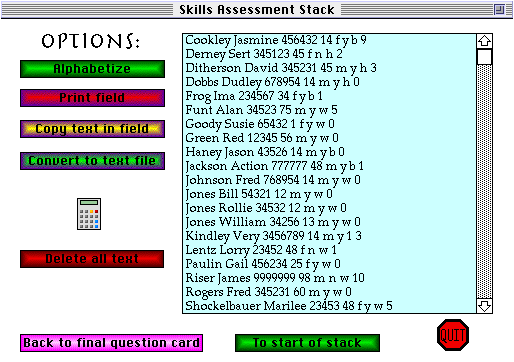
Input by the students and their scores are stored in this portion
of the assessment tool. Names
can be alphabetized with the click of a button. The information
may be printed. The data may be
copied and pasted into a database program for analysis. Or the
information may even be saved
as a text file for later use in a database program. This capability
will allow educators to monitor the
progress of any specific group of students and tailor our teaching
to the needs of our students.
This Skills Assesment Tool is another example how I tried
to improve instruction through the
use of technology.


